Polarization in Cathodic Protection
Quick answer
Polarization is a change in electrode potential caused by current crossing the electrode/electrolyte interface.
In cathodic protection, cathodic polarization is the potential change in the cathodic/negative direction produced by protective current.
Do not confuse polarization (the change), polarized potential (the potential value at the polarized state), Instant-OFF potential (an interruption-based measurement that can represent polarized potential when its conditions are satisfied), and the 100 mV Polarization Criterion (a decision rule requiring demonstrated polarization change).
Polarization versus polarized potential
| Term | Controlled meaning |
|---|---|
| Polarization | Change from an open-circuit/free-corrosion state caused by current across the interface |
| Cathodic polarization | Polarization in the cathodic/negative direction |
| Polarized potential | Interface potential at a given polarized state |
| Instant-OFF potential | Immediate post-interruption measurement intended to approximate or measure polarized potential under controlled conditions |
A change and a potential value are different quantities. Keep them separate in field records and criterion logic.
Native, free-corrosion, and open-circuit potential
Open-circuit/free-corrosion potential is the preferred technical comparison concept. Native potential is acceptable common field language when the intended state is clear.
Do not assume the baseline remains constant under changing environment or stray-current conditions.
Current-applied / ON potential
The ON potential is measured while CP or influencing current is flowing. It can contain the structure/electrolyte interface potential, voltage-drop components outside the interface, and other current-related influences.
That is why the ON value is not itself a direct measure of polarization change.
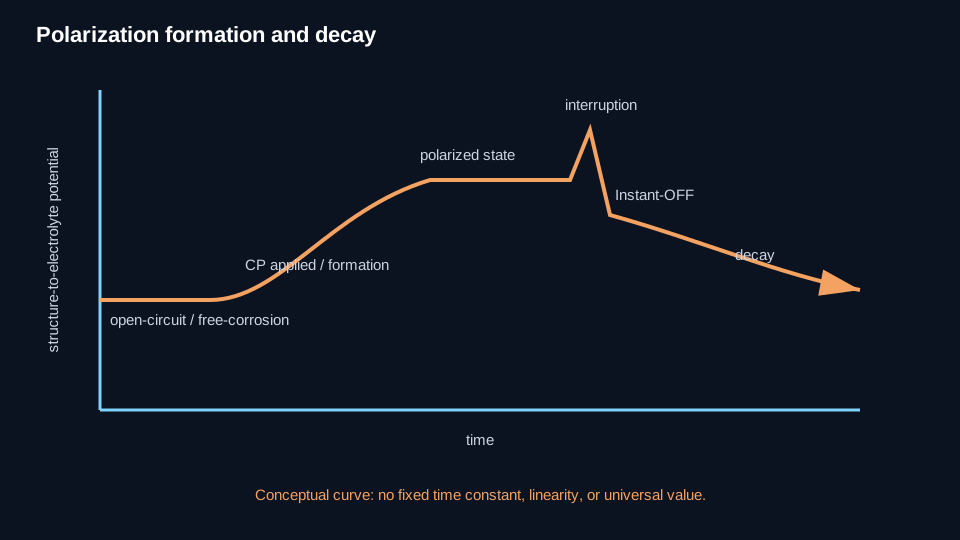
Polarization formation
Polarization formation is the increase in cathodic polarization after CP is applied or increased.
For criterion use, the comparison requires a defensible initial/free-corrosion basis and a defensible later polarized state. The applicable criterion—not this general reference—controls the required magnitude and applicability.
Polarization decay / depolarization
When protective current is interrupted or removed, cathodic polarization begins to decrease.
A decay test compares a defensible starting polarized state with a later potential after some polarization has been lost. Where the governing criterion permits it, demonstrating the required decay can establish the required polarization change without waiting for complete return to the original free-corrosion potential.
Why ON − Instant-OFF is not “polarization”
The ON-to-Instant-OFF change can indicate the voltage change caused by interruption under controlled conditions. It commonly reflects current-related voltage-drop changes.
Polarization is defined by change from the open-circuit/free-corrosion state caused by current across the interface.
ON − Instant-OFF is not the definition of polarization.
Polarization and Instant-OFF
A valid Instant-OFF measurement can provide a defensible polarized-potential value.
It does not by itself tell you the magnitude of polarization. To determine polarization change, compare appropriate states.
What can make the comparison unreliable?
- Unstable or changing free-corrosion baseline.
- Incomplete interruption.
- Delayed measurement and decay during capture.
- Stray or telluric current.
- Environmental changes.
- Mixed-metal effects.
- Invalid reference-electrode condition or placement.
- Meter/circuit problems.
Polarization is not a criterion
Polarization is an electrochemical condition/change.
The 100 mV Polarization Criterion uses a specified minimum polarization change as a decision rule within an authorized asset scope. The −850 mV CP Criterion uses an absolute-potential route within its authorized scope and measurement conditions.
Those criteria remain separate authoritative Criterion resources; this Polarization Reference does not duplicate their decision logic.
What to check next
For a defensible polarized-potential measurement, use Instant-OFF Potential and the applicable current-interruption method when available.
If voltage-drop effects are in question, use IR Drop. Criterion decisions remain with their separate authoritative criterion resources when constructed.
Technical visuals