Current Distribution & Attenuation
Quick answer
Cathodic-protection current is rarely distributed uniformly over a real structure.
Total current tells you how much current the system supplies. Current distribution tells you where the electrical effect goes.
A rectifier or galvanic-anode system can supply enough total current and still leave some locations weakly protected. A calculated Current Requirement therefore does not prove that every part of a pipeline or other structure receives adequate protection.
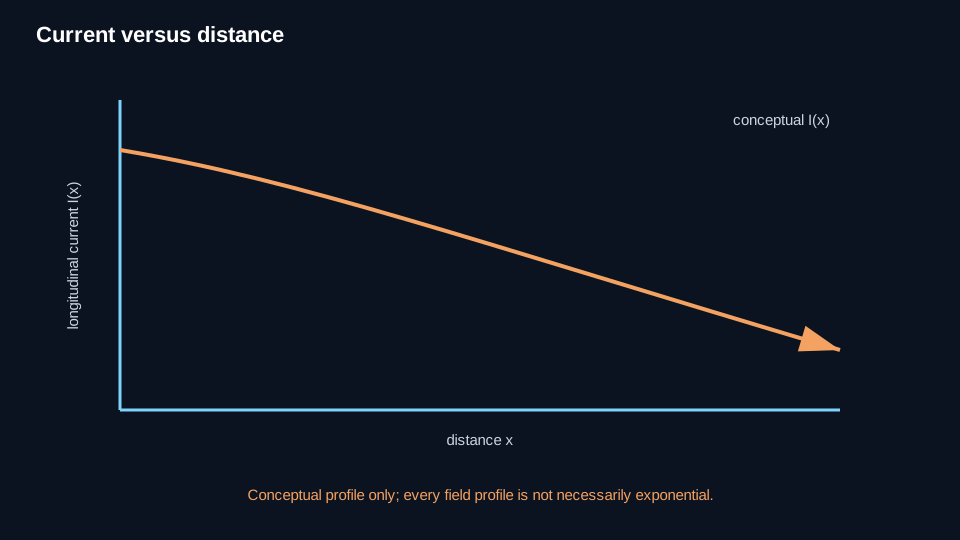
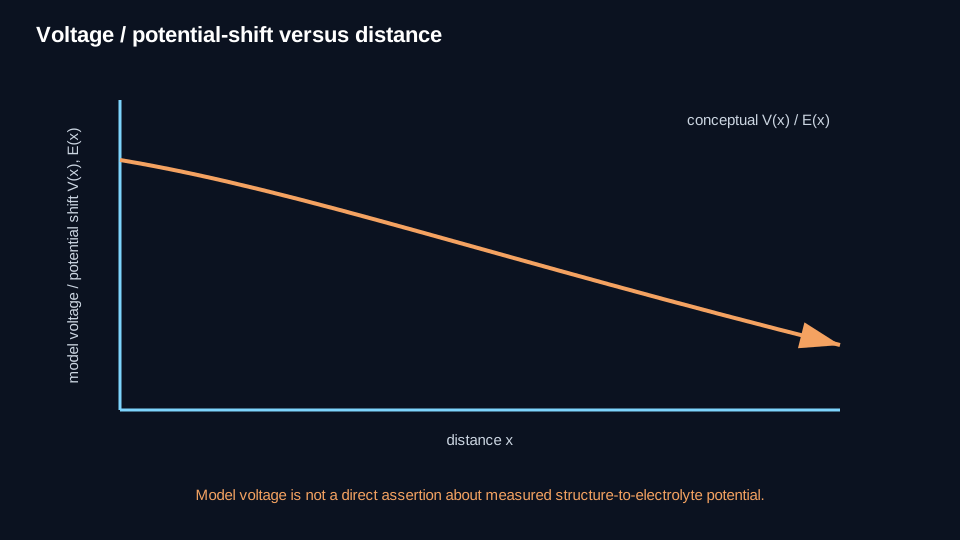
Current distribution describes this spatial behavior. Attenuation describes the reduction or change in current and the associated structure voltage/potential effect with distance in a distributed electrical system.
Why protection can become weaker with distance
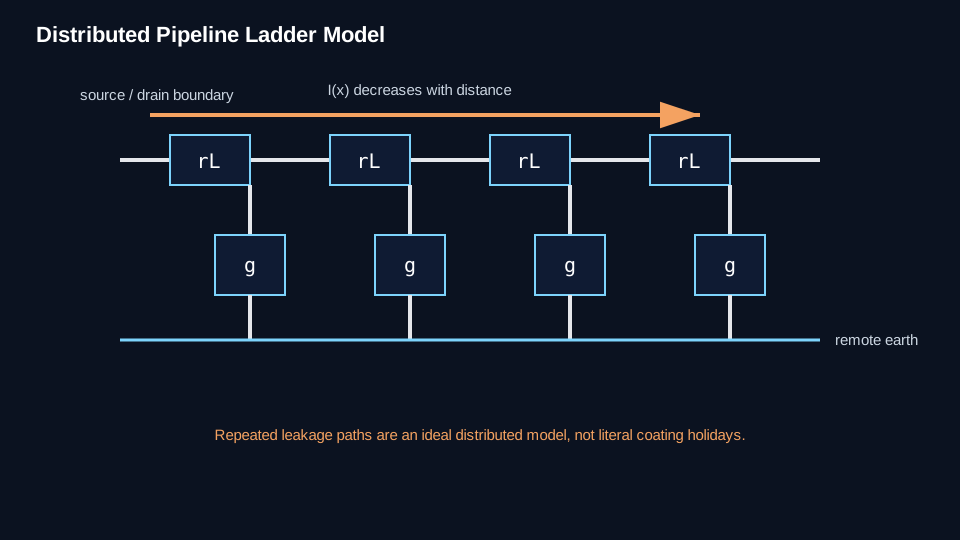
On a long electrically continuous pipeline, CP current that enters the pipe must travel through the metal toward the negative/drain connection while current also transfers between the pipe and the surrounding electrolyte along the route.
The pipe has finite longitudinal resistance. The distributed coating/electrolyte path also has finite resistance or conductance. Together, those properties cause pipeline current and CP-produced structure voltage/potential shift to change with distance.
This is the physical basis of distributed-line attenuation behavior. An ideal uniform model is still only a model of an idealized section, not proof that the real field system is uniform.
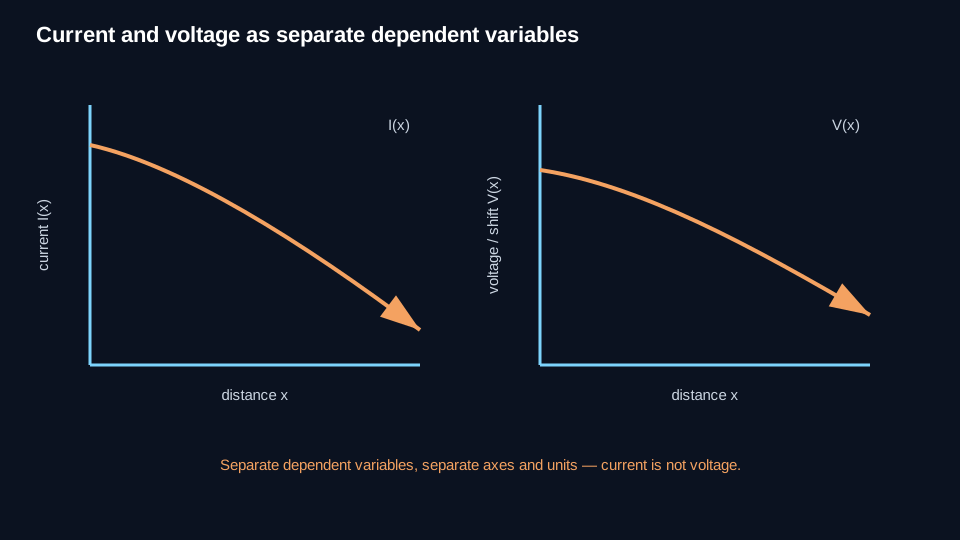
Current attenuation and potential attenuation are different quantities
Distributed-line behavior can involve both longitudinal pipeline current and structure voltage/potential shift relative to remote earth. They are separate dependent quantities.
A measured structure-to-electrolyte potential profile is therefore not automatically a direct measurement of pipeline current distribution. Potential measurements have their own measurement and IR-drop considerations.
Also keep electrolyte IR drop separate from longitudinal metallic voltage drop. They are not the same physical quantity.
What controls current distribution?
Important influences include:
- longitudinal resistance of the structure;
- coating/leakage resistance or conductance and coating quality;
- size and geometry of coating holidays or defects;
- electrolyte resistivity and changes in resistivity along the route;
- anode or current-source location, number, and spacing;
- structure geometry and shielding;
- electrical isolation and grounded attachments;
- polarization and environmental variation; and
- source and boundary conditions.
These factors do not all appear as independent inputs in every attenuation model. Some are qualitative influences, some affect model inputs, and some can make a simple uniform model inappropriate.
Primary and secondary current distribution
Primary current distribution is controlled principally by the electrical resistance of the available current paths before significant polarization changes the electrochemical response.
As polarization develops, the electrochemical response changes the effective current demand/back-voltage behavior. This produces secondary current distribution.
Polarization can therefore change distribution with time. No universal polarization correction factor is authorized for this Reference.
Coating, leakage, local defects, and source location
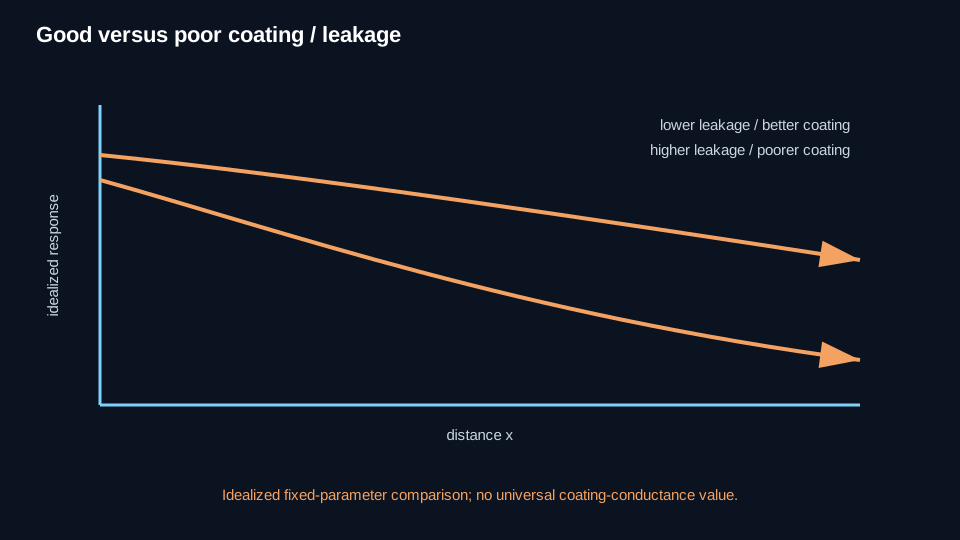
For a uniform distributed-line model, lower leakage conductance—equivalently higher leakage resistance—reduces current loss along the line and generally improves the ability of a source to influence more distant locations.
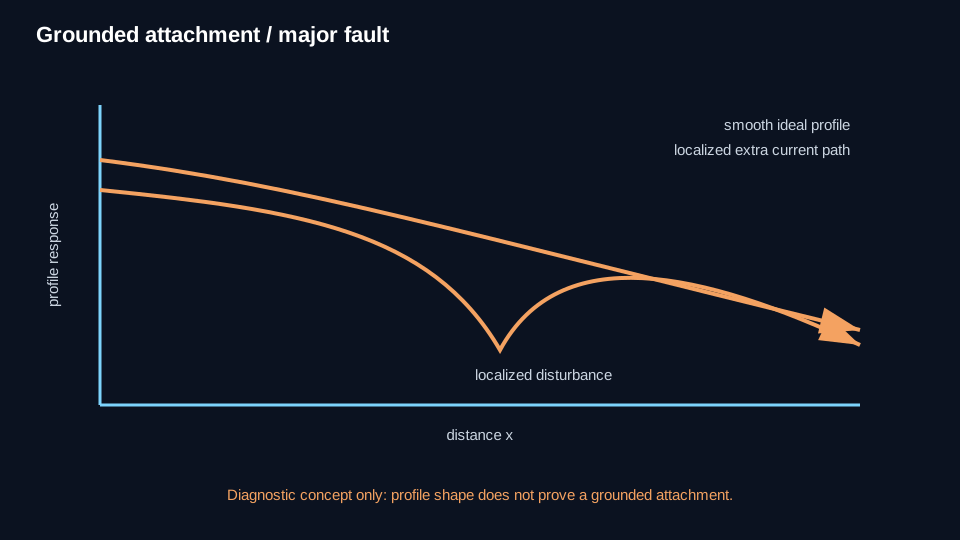
Real coating defects are not necessarily uniformly distributed. A few large defects, many small holidays, a major coating failure, or a grounded attachment can produce field behavior that differs greatly from a uniform model.
Local current density at a coating defect is different from longitudinal pipeline current. Small holidays can experience high local current density; that local spreading behavior supports the distribution concept but is not the pipeline attenuation model.
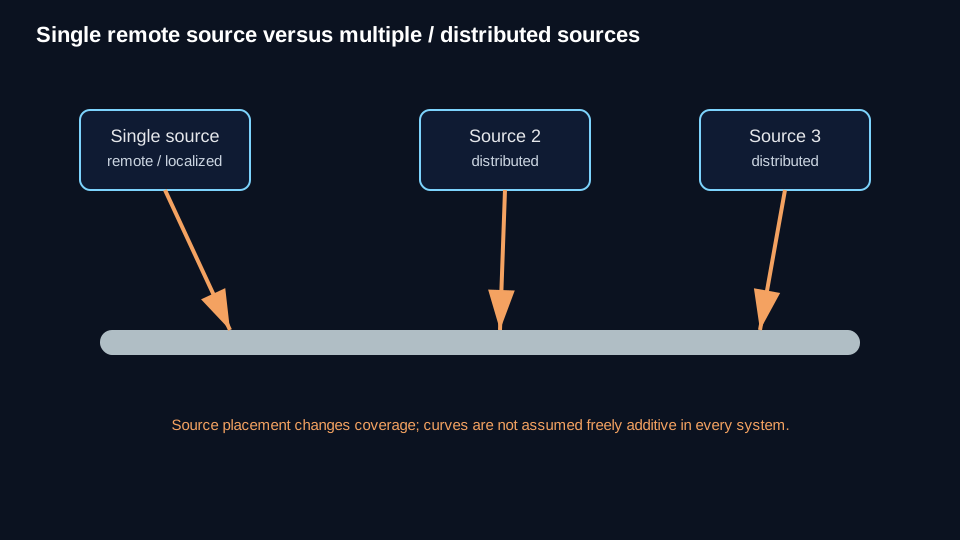
Source location also matters. Sources closer to a location generally have shorter or lower-resistance current paths to that location than remote sources, all else equal. Distributed sources can improve coverage, but multiple-source behavior cannot always be represented by simply adding independent curves.
Bounded attenuation models
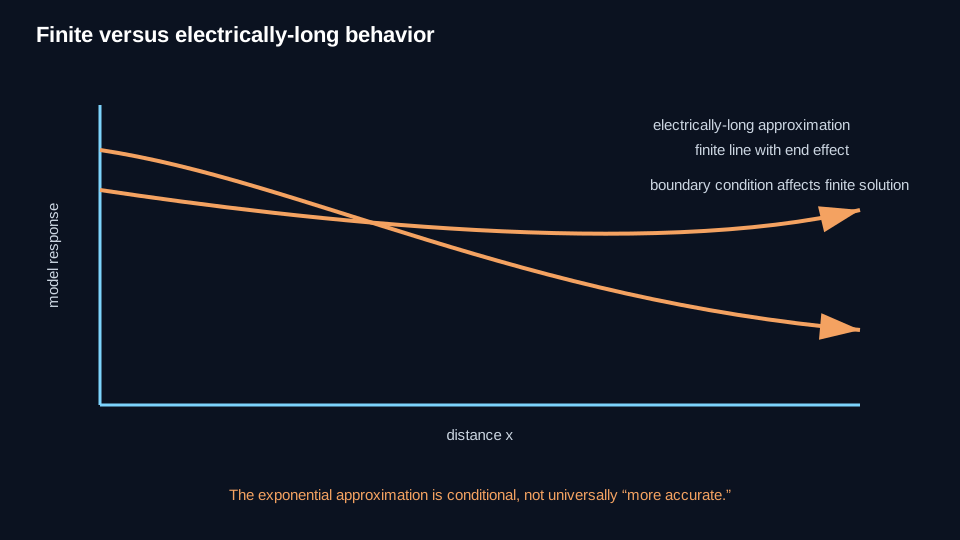
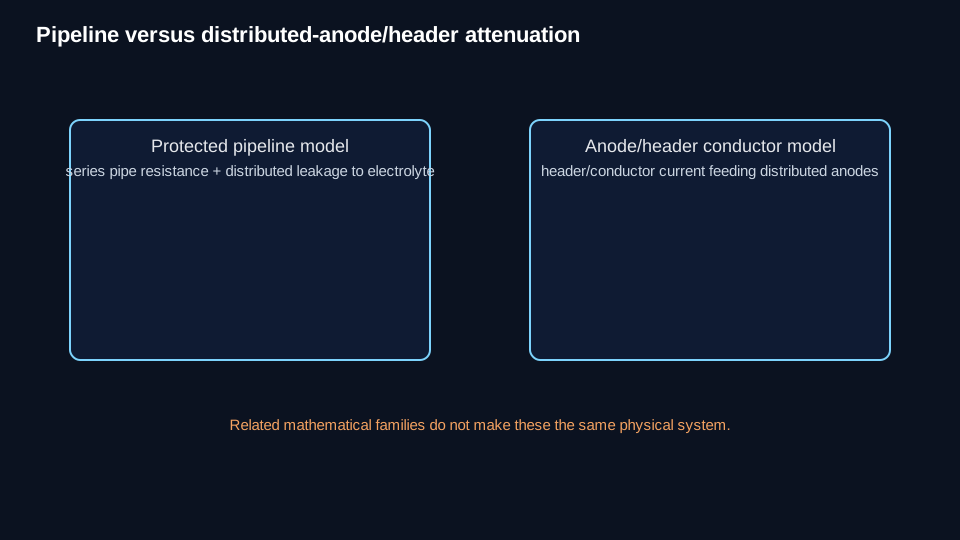
Bounded attenuation models exist for specific physical systems and boundary conditions, including a finite uniform pipeline line, an electrically-long pipeline approximation, and distributed-anode/header behavior.
Those calculation manifestations are not published in this Gate. They require controlled assumptions and boundary conditions and must not be treated as one generic attenuation calculator.
The finite uniform line is relevant when end-boundary effects matter and the necessary boundary conditions are known. The electrically-long approximation is only appropriate when receiving-end effects can be neglected for the question being asked. Distributed-anode/header attenuation describes a different conductor and must not be substituted for protected-pipeline attenuation.
When a simple uniform model should not be trusted
Treat a one-section uniform attenuation result cautiously or reject the model when coating condition changes materially, soil/electrolyte conditions vary strongly, a major defect or grounded attachment changes leakage, continuity or isolation is uncertain, multiple sources materially interact, polarization invalidates fixed-parameter assumptions, facility geometry is not well represented by a long uniform conductor, the measured profile changes abruptly, foreign DC may be affecting the structure, AC/telluric interference is involved, or a required boundary condition is unknown or unsupported.
One measured apparent soil-resistivity value does not define the distributed leakage resistance of an entire pipeline model, and this Reference establishes no soil-to-attenuation conversion rule.
Field interpretation
Strong protection near a source with weaker protection farther away can be consistent with attenuation, but attenuation is not the only possible cause.
Depending on the observation, check the appropriateness of the system model and route investigation toward actual source output and location, electrical continuity and isolation, attachments, coating/leakage behavior, major defects, soil/environmental variation, polarization, measurement validity, and interference.
These are investigation routes, not automatic root-cause diagnoses. Do not correct a weak remote profile merely by increasing total current without first determining why remote distribution is poor.
An abrupt field-profile change is a warning that the real system may not be uniform. The attenuation model alone does not diagnose the cause.
Relationship to Current Requirement and soil resistivity
A system can supply its calculated total Current Requirement and still have inadequate current distribution at some locations. Current Requirement determines a total-current need within its own controlled calculation; it is not a distribution calculation.
Soil Resistivity — Wenner Apparent Resistivity provides an authoritative apparent-resistivity calculation. A Wenner result can inform understanding of electrolyte conditions, but one apparent-resistivity value must not be treated as the distributed leakage resistance of an entire pipeline section.
Relationship to interference
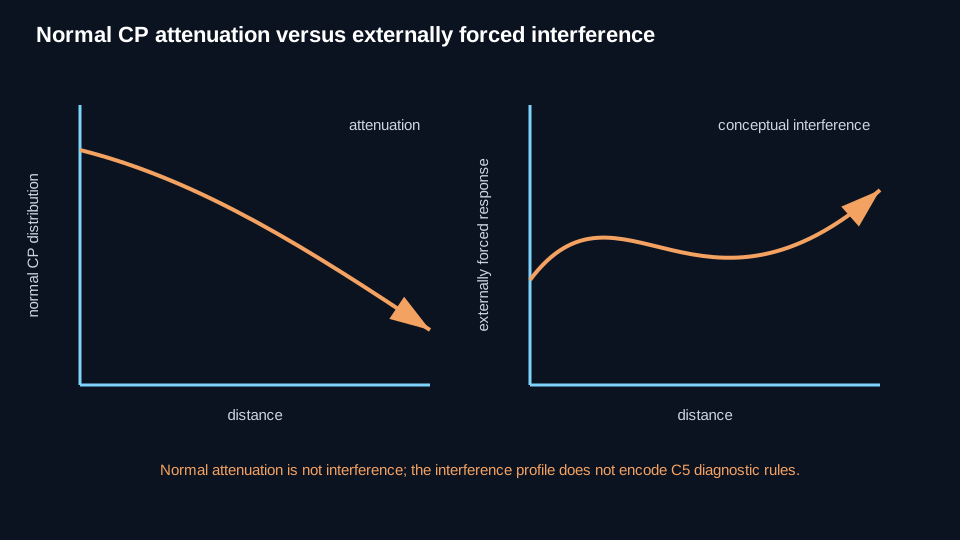
Normal CP attenuation describes spatial behavior caused by the protected system's distributed electrical properties and boundary conditions.
Externally forced DC interference and AC/telluric interference are separate phenomena with different source behavior. Do not treat an externally forced interference profile as ordinary CP attenuation, and do not reuse a normal attenuation model as a generic interference model.
Unexpected spatial behavior can require interference evaluation. Public interference links are intentionally withheld until those canonical resources are constructed.
Measurement dependencies
Use the authoritative Structure-to-Electrolyte Potential, IR Drop, Polarization, Reference-Electrode Placement, and Meter Loading resources when interpreting field potential data. This Reference does not duplicate those measurement controls.
Practical boundary
Use current-distribution and attenuation concepts to frame a bounded physical question and compare idealized behavior with field evidence. Keep the quantity of interest clear: longitudinal current and structure voltage/potential shift are not interchangeable.
Do not force field data to fit a uniform model when the system, boundary conditions, or measurements do not support that model.
Technical visuals